Explore More Dashboards
Oil And Gas
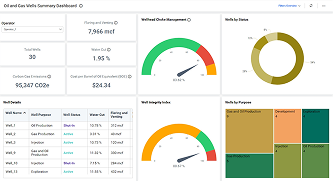
Oil and Gas Wells Summary Dashboard
This dashboard showcases the oil and gas KPIs that decision-makers depend on to track both daily operations and trends that occur over longer periods of time.
Oil And Gas
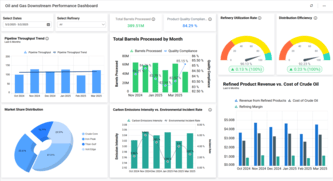
Oil and Gas Downstream Dashboard
Enhance your downstream operations with our Oil and Gas Downstream Dashboard, tracking refinery metrics, costs, and production trends in real time.