
Telecom Customer Satisfaction solution overview
The Telecom Customer Satisfaction Dashboard sample shows how Bold BI can present customer service dashboard, telecom dashboards, rockset db, rockset in an embedded analytics experience. It is designed for users who want to evaluate dashboard layout, filtering, interaction, and reporting patterns before building a similar experience in their own application.
See moreSee less
Analyze telecom KPIs like customer satisfaction, subscription trends, and service quality.
This dashboard belongs to the Telecommunications section under Solutions. It can help teams review performance trends, compare important measures, and identify areas that need attention without leaving the application workflow.
Users can study this sample as a reference for organizing customer service dashboard, telecom dashboards, rockset db and rockset in a clear dashboard experience. The page gives search engines static context about the dashboard purpose while the embedded sample lets visitors inspect the interactive reporting flow.
The sample is useful for product teams, developers, analysts, and business users who are comparing embedded analytics options. It shows how a dashboard page can combine a focused business summary, visual exploration, and related examples in one crawlable sample browser experience.
Related examples in this section include Network Performance Dashboard, Telecom Management Dashboard. Reviewing these connected samples gives a broader view of the available Telecommunications dashboard scenarios.
View all Telecommunications dashboards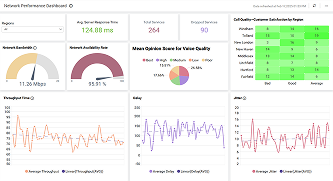
Telecommunications
Network Performance Dashboard
Monitor network performance, call processing, and data transmission efficiency.
Telecommunications
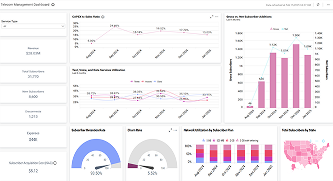
Telecom Management Dashboard
Track telecom revenue, subscriber growth, and network usage for strategic decisions.